Tutorial 4. Trait evolution
Summary:
This tutorial describes the use of RASP to examine social grouping patterns among primates as in Shultz et al. (2011). It will take you through the processing of trees and states and the methods of inferring ancestral states for sociality in primates.
Information of data source
The consensus tree and 100 trees were downloaded from the 10k Trees Website (https://10ktrees.nunn-lab.org, Arnold et al., 2010). The sociality character is modified from Shultz et al. (2011), in which A=solitary, B=pair-living, C=uni-male and D=muti-male.
Please notice that we use less than 1/5 data of the original dataset as an example, therefore the result may not be exactly the same as the original paper.
ALL files used in this tutorial are stored in examples/Primate/. If you are a beginner of RASP, please start from Tutorial 1.
Loading the data files
Click [File> Close Current Data] or reopen RASP to clear the current trees.
Open [File > Load Trees> Load Trees (more format)] and navigate to Trees_States /100Trees.trees and select it.
Open [File> Load Consensus Tree> Load User-specified Tree] and navigate to Trees_States /Primates.tree and select it.
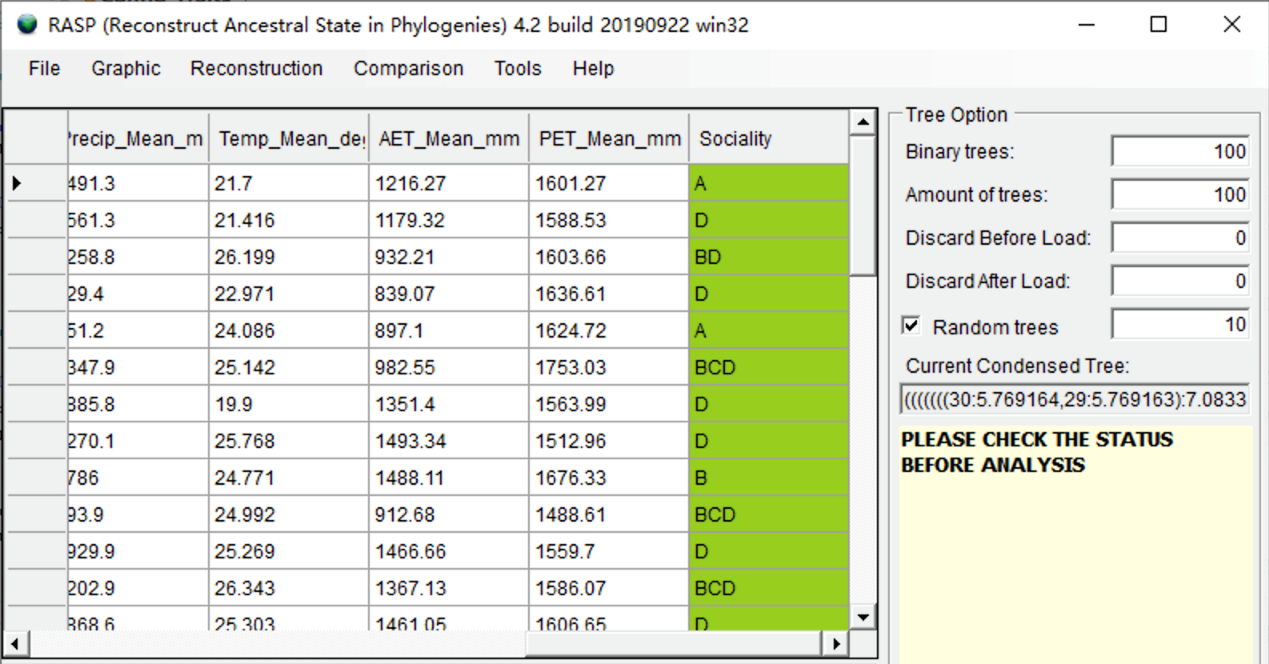
Open [File > Load States (Distributions)], navigate to States/characters.csv and select it.
Click the head of a column to select it. In this exercise, we select the "Sociality" trait. Change the value of Random trees to 10 and keep it clicked (We use 10 random trees for a quick analysis in this tutorial, you could use a greater number in practice). You will see a window like this:
Evaluate traits evolution using BayesTraits implemented in RASP
To use BayesTraits, the branch lengths of your trees should proportional to the number of substitutions per site as reported by the program MrBayes.
Open [Reconstruction> On Trees> MultiState Reconstruction in BayesTraits, and you will see a window like this:
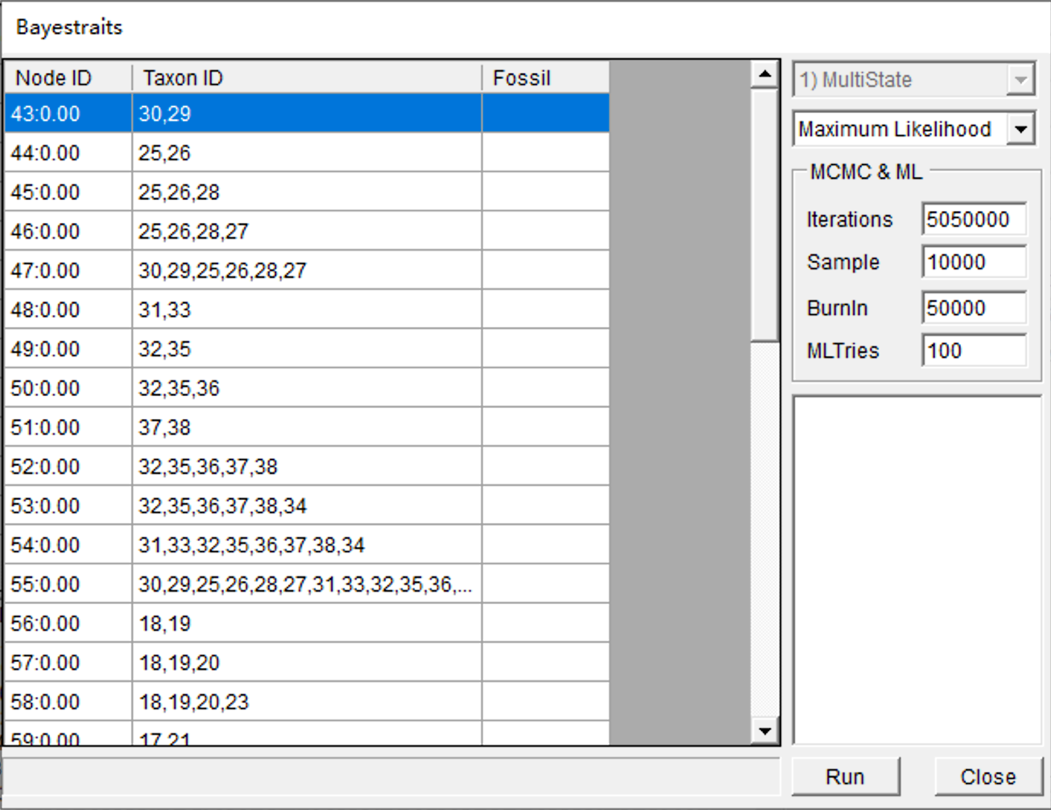
You can keep everything as default and click "Run". You may see a command window (in Windows) with some additional information. Keep it open until it closes automatically. This analysis took about 2 minutes to run on my i7 laptop. Then you will see two windows open:
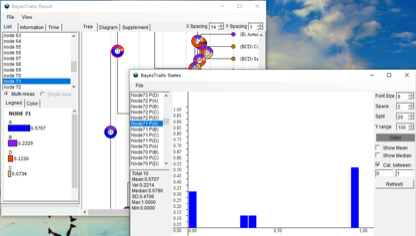
In the BayesTraits Result window, the pie charts show the probability of the state at each node. For instance, the probability of solitary at node 71 is 0.5707. In the BayesTraits States window, histograms represent the posterior probability distribution of each social state at the nodes indicated.
You can save the results by using [File> Save Result].
NOTE: We only used 10 random trees and a small default MLTries value, and therefore the results might be different. Please increase the above settings to at least 100 and 500 in practice. The ancestral states were summarized on the consensus tree.
NOTE: Users who want to run BayesTraits using a single (species) tree could load the single tree as the trees dataset.
Evaluate trait evolution using the BBM model
The BBM model needs a consensus tree only and does not use branch length information. Open [Reconstruction> On Consensus Tree > Bayesian Binary MCMC (BBM)], and you will see a window like this:
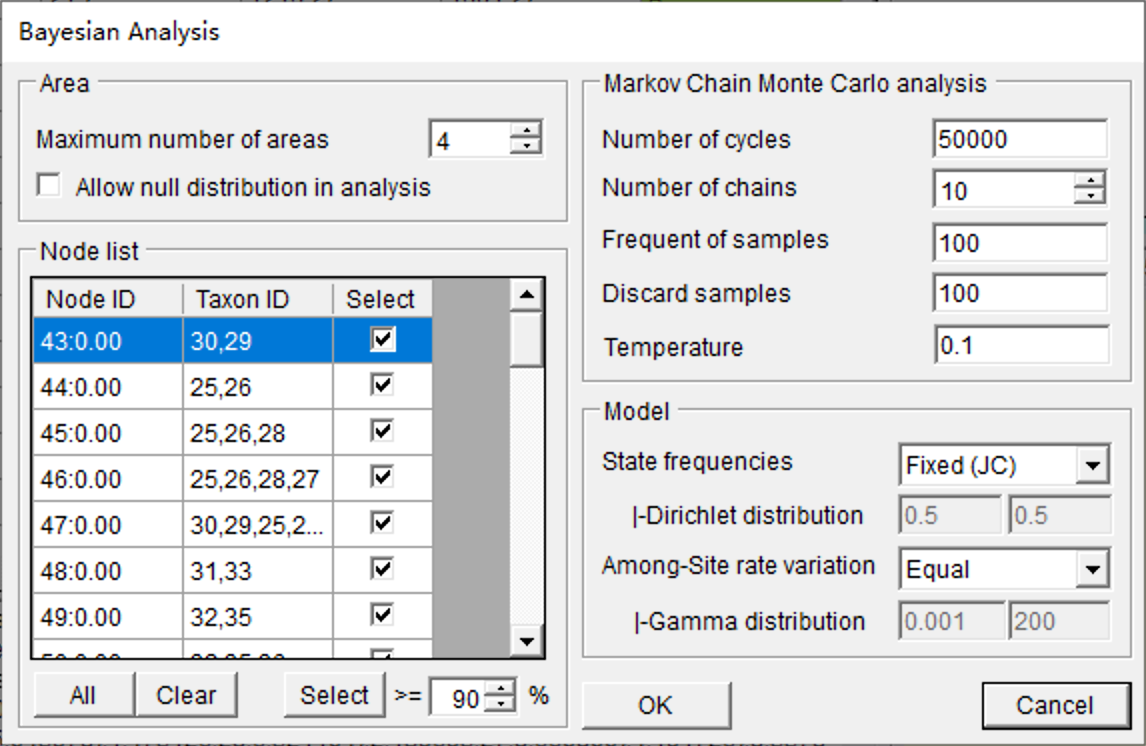
You can keep everything as default and click OK (See section 3.3.8 of the RASP manual for the details of settings). This analysis took about 10 seconds to run with default settings. Open [Graphic->Tree View] to see and save the results.
References
Arnold, C., Matthews, L. J., & Nunn, C. L. (2010). The 10kTrees website: a new online resource for primate phylogeny. Evolutionary Anthropology: Issues, News, and Reviews, 19(3), 114-118.
Kamilar, J. M. & Cooper, N. (2013). Phylogenetic signal in primate behaviour, ecology and life history. Philos Trans R Soc Lond B Biol Sci, 368(1618), 20120341.
Shultz, S., Opie, C., & Atkinson, Q. D. (2011). Stepwise evolution of stable sociality in primates. Nature, 479(7372), 219-222.